<<
Back to Kanarev's Physchemistry Book Index
12.2
Diagrams of Models of Plasma – Electrolytic Reactors
Our theoretical
investigations have been accompanied by the publication and patenting the
results being obtained. It is known that a patent for a mode and device is the
most valuable one, that’s why a claim for such a patent was made one of the
first claims. Five years later the patent No. ........ for the mode and the
device for production of thermal energy, hydrogen and oxygen was obtained (Fig.
86).
Fig. 85 shows a
diagram of the simplest plasma electrolytic reactor, for which the patent No.
2157862 has been received [86].
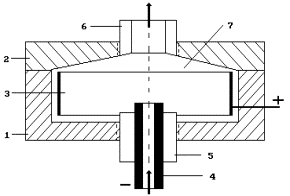
Fig. 85. Diagram of
plasma- electrolytic reactor (the patent No. 2157862)
1 - housing of the reactor, 2- lid of the reactor, 3 – anode, 4 –
cathode (inlet pipe),
5 – bushing, 6 – outlet pipe, 7
– interelectrode chamber
Chamber 1 and lid 2
of the reactor (Fig. 85) can be made of acrylic plastic or fluoroplastic. It
is desirable to make anode 3 of titanium covered with ruthenium oxide (ortho)
or simply of titanium. Hole cathode 4 is made of molybdenum. Bushing 5 and outlet pipe 6 are made of fluoroplastic. The areas of working
surfaces of the anode and the cathode are chosen in such a way that density of
current density on the cathode exceeds
current density on the anode several dozen times, and the distance
between the anode and the cathode is equal to 8…10 cm. Weak (one molar)
solutions of alkali, acids, etc., can serve as working solutions.
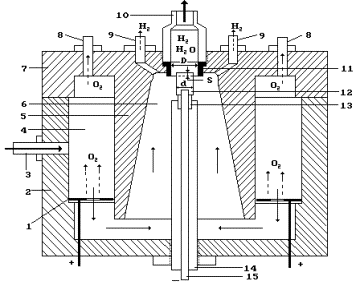
Fig. 86. Diagram of
plasma- electrolytic reactor
(the patent No. ……)
Fig. 87 shows a
diagram of the reactor, for which the patent No. 2157427 has been received
[85]. The diagram of the plasma electrolytic reactor, for which the patent No.
2157861 has been received, is given in Fig. 88 [87].
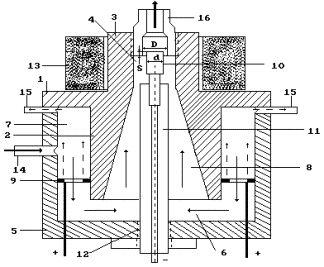
Fig. 87. Diagram
of a model of the plasma electrolytic reactor
(patent No. 2157427): 1- body, 5 – lead, 9 – anode, 10- cathode, 13 –
magnet

Fig.
88. Diagram of a model of the plasma electrolytic reactor (patent No. 2157861)
1- body, 4 – lower lead, 5 – upper lead, 10 and
14 – anodes, 11 and 15 – cathodes
We’d like to warn
in advance that the effect is demonstrated in a narrow range of the combination
of various parameters of the reactor and plasma – electrolytic process.
The plasma -
electrolytic reactor generates energy being available in heat of heated water,
water steam of various temperature, atomic and molecular hydrogen, oxygen,
ozone, light radiation and noise.
It is not easy to
register each of the above-mentioned types of energy separately. It is easy to
measure thermal energy being available in heated water and stream. The
experience has shown that it is enough for the proof of positive efficiency of
the plasma – electrolytic reactor.
Efficiency of the reactor determines the general index of
efficiency ![]() taking into
consideration electric power
taking into
consideration electric power ![]() being introduced into
the reactor thermal energy
being introduced into
the reactor thermal energy ![]() , which is accumulated in heated water solution and water
vapour and energy
, which is accumulated in heated water solution and water
vapour and energy ![]() being available in
released gases (hydrogen and oxygen) as well as light energy
being available in
released gases (hydrogen and oxygen) as well as light energy ![]() and noise energy
and noise energy ![]() [109]
[109]
![]() (298)
(298)
But one should bear in mind that not all designs of the
reactors and not all operation modes demonstrate positive (K0 >1)
efficiency. It is easy to burn plasma, but it is difficult to produce additional energy from
it.
Nevertheless, the official commission,
which consisted of the specialists of the adjacent fields of knowledge, proved
positive energy efficacy of one of the reactors and one of the modes of its
operation.
12.3.
Laws of Change of
Voltage, Current and Power in Power Supply Circuit of the Plasma-electrolytic
Reactor
Let us analyse the
oscillograms of voltage, current and power in the electric circuit, which
supplies the plasma-electrolytic reactor with power in the gas operation mode.
Figs 89, 90, 91 show an
oscillogram of voltage, current and power obtained by us together with the
specialists of St.-Petersburg firm “Algorithm”. The measurements were carried
out with the help of the electron oscillograph “Handyscope-2”, which registered
10000 ordinates in 0.1 range; it provided high accuracy of the measurements.
The measurements results correspond the reactor mode intended for production of
gases, not heat. The measurements were carried out at the same time in three
ways: with the help of the voltmeter and ammeter, the electric meter and the
electron oscillograph. The following readings were registered in the protocol
of control experiments during the experiment (300 s) given for one hour of the reactor
operation:
1. Voltmeter and
ammeter – 587 W;
2. Electron
oscillograph – 716 W;
3. Electric meter –
720 W.
The commission has
made the conclusion that the measurements of the electric power consumed by the plasma-electrolytic reactor made with
the help of the electric meter are the
correct ones. It is necessary to add that the given data correspond only to one
operation of the reactor, which plasma glow irregularity can be clearly seen
without any measurement and is easily observed due to sharp deviations of the
pointer of the ammeter. But there are such operation modes, at which plasma
burning is stable, and the pointer of the ammeter does not oscillate.
Unfortunately, the indices of such operation mode have not been registered with
the help of the electron oscillograph, and we have no comparative data on
measurements for this mode. We can only suppose that the readings of the
voltmeter and the ammeter deviate insignificantly from the indices of the
electron oscillograph and the electric meter [109].
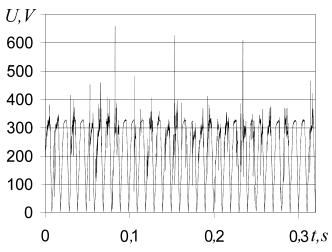
Fig. 89. Voltage
change oscillogram in power supply net of
the plasma-electrolytic reactor
Fig. 89 shows the
oscillogram of voltage across the circuit of power supply of the reactor
adjusted for gas operation mode. The voltmeter has shown stable voltage of 220
V at this mode. Sharp deviations of voltage are observed on the oscillogram.
Carrier frequency of rectified voltage
of 100 Hz has harmonic with less amplitude and greater oscillation frequency.
The reduction of the amplitude of carrier frequency is interrupted in a simple way: short-time increase of current
has led to short-time reduction of voltage.
It is more
difficult to explain a voltage amplitude increase. Availability of a capacitor
or an inductor in the circuit can be the cause, energy can be accumulated there
and then released increasing voltage in
the power supply net. It is difficult to estimate capacity value of the reactor
consisting of the flat anode and the core cathode. The transformer has
inductive capacity in the power supply circuit. It is possible to determine its
role in the formation of voltage oscillations, which amplitude is above the
carrier frequency amplitude. Three oscillations with amplitude up to 600 V and
higher are the exception (Fig. 89). The processes, which take place in the
reactor can be the only source of these oscillations. Which processes? We do
not know yet. We can suppose that they correspond to the processes of birth of
helium atoms, then we should acknowledge availability of cold nuclear fusion. These
oscillations can be connected with the process of trapping of the electrons by
the protons and the formation of the neutrons [51]. An exact answer for this
question will be given due to the results of further investigations.
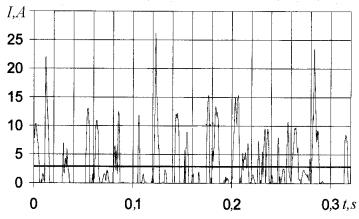
Fig. 90. Current change
oscillogram in power supply circuit of the plasma-electrolytic reactor
Fig. 90 shows the
electric current oscillogram. Its maximal values are 25 amperes, but these
peaks are connected in time with the voltage increase peaks (Fig. 89). Gaps of
time are clearly seen when current is completely unavailable. Its average value
is equal to 3.8 amperes. Intensive deviations of the pointer of the ammeter
have been observed [109].
Certainly, the gaps
of time connected with absence of current in the power supply circuit of the
reactor have much information concerning the plasma-electrolytic reactor itself
(Fig. 90).
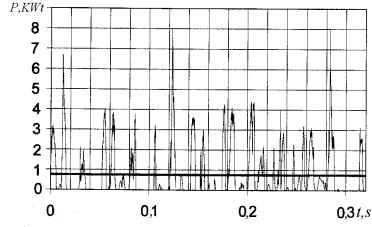
Fig. 91. Power
change oscillogram in power supply circuit of the plasma-electrolytic reactor
First of all,
chaotic character of the proton separation of hydrogen atoms from water
molecules is a cause of such chaotic change of strength of current. The gas –
vapour mixture promotes it. As it is accumulated near the cathode and has no
time to exceed the limits of the pericathode space, it insulates partially,
sometimes completely the cathode from the solution increasing resistance in
power supply circuit. As a result, the electric circuit is constantly
disconnected, value of current is reduced up to zero. In the moments when strength of current is equal to zero, the plasma is extinguished. When pericathode
space becomes free from gas – vapour mixture, and the solution comes into
contact with the cathode, strength of current is increased sharply. Thus, when
the gases are generated, the reactor operates in pulse mode, at which other
resonance phenomena are possible, and, consequently, the sharp increase of efficiency
of the process [109].
Power change
regularity (Fig. 91) in power supply
circuit of the plasma-electrolytic reactor in the gaseous mode of its operation
is similar to the change of strength of current. Peak power reaches 8 kW though
its mean value is only 720 W.
12.4. Protocol
of Control Experiments
May 22, 1998, City
of Krasnodar
The plasma –
electrolysis reactor was elaborated by
the chair of theoretical mechanics of the Kuban State Agricultural University by Prof. Ph.M. Kanarev, doctor of
technical sciences and E.D. Zykov, candidate of chemical sciences, and was
presented for control testing to a commission formed by [65], [109]:
V.V. Fomin – head
of the Chair of Physics of the Kuban
State Agricultural University, Doctor of physical and mathematical sciences,
professor, the Chairman of the commission;
Members if the
commission, including:
A.S. Trofimov,
professor at the Chair of Industrial Thermoenergetics of the Kuban State
Technological University, Doctor of technical sciences, Honoured Scientist of
Russia, Associate Member of the International Academy of Higher Education,
winner of the prize of the Government of the Russian Federation for science and
engineering (thermal power engineer);
N.P. Berezina,
Doctor of chemical sciences, professor of the Kuban State University
(electrochemist);
Ph. M. Kanarev,
head of the Chair of Theoretical Mechanics of the Kuban State Agricultural
University, Doctor of technical sciences, professor;
N.A. Singaevsky,
Candidate of technical sciences, assistant professor of the Krasnodar higher
military school for rocket troops, colonel (power engineer);
E.D. Zykov,
Candidate of chemical sciences (physical chemistry of surface phenomena).
The commission has
performed control experiments of the plasma-electrolytic reactor.
1. The unit with
the diameter of 130 mm and the height of 100 mm is made of dielectric material
(acrylic plastic and Teflon) has the inter-electrode chamber, the anode, the
cathode and the connections for feeding of working solution into the reactor
and withdrawal of heated liquid and vapour - gaseous mixture out of it.
2. The reactor is
connected to the supply line of rectified current with adjustable voltage.
3. Diluted alkaline
water solution with flow controlled by a valve according to the flow measuring
instrument serves as heat - transfer medium.
4. The solution and
the vapour - gaseous mixture heated by the reactor are removed from the reactor
via a branch pipe.
The reactor
operates as follows. The desired flow of the solution is established with the
help of a rotameter, and power with initial voltage near to zero is turned on.
Then voltage is stepped up, and at 150-200 V stable plasma is formed in the
pericathode space. In a few seconds after the appearance of plasma the outflow
of the heated solution and the vapour - gaseous mixture starts. Quantity of
vapour can be controlled. In order to increase the accuracy of the measurements
the reactor has been adjusted for heating of the solution at a minimal quantity
of vapours being formed.
Instruments and Equipment Used for the Experiment
The instruments
used for input power measurement: an electric meter, voltmeter (accuracy class
0.2, GOST 8711-78), ammeter (accuracy class 0.2, GOST 871160).
The instruments
used for output power measurement: mercury thermometers with value of a
division of 1 and 2 degrees and with the scales up to 100 and up to 160
degrees, respectively; measuring vessels with capacity of 3 litres, measuring
glasses with capacity of 1000 ml, a
stopwatch with value of a division of 0.1 s, a balance with value of a division
of 5 grams.
Methodology of Experiment
A measuring vessel
with capacity of 3 litres was placed 0.7 meters above the reactor on the
balance and was connected with the reactor with the help of the pipes via the
rotameter used as a solution flow rate
indicator. The desired flow rate was established, and the reactor was started.
After its operation mode became stable, and the solution level was lowered to
the control marker, the stopwatch was turned on, and the solution weight change
indication and counting of the number of the electric meter disk rotations and
the recording of the reading of the voltmeter and the ammeter began.
Simultaneously the outflow of the solution is connected to the measuring glass,
which weight was determined beforehand.
During the
experiment the following data were registered: the time of starting and ending
of the experiment, the electric meter readings, the mean values of voltmeter
and ammeter as well as the reading of the thermometers measuring the
temperature at the inlet and the outlet of the solution. Besides, the
insignificant deviations of the solution consumption were periodically adjusted
according to the reading of the rotameter.
The experiment was
finished when the reduction of the weight of the solution in the measuring
vessel arranged on the balance attained the check value. At this moment the
outlet of the solution from the reactor was switched to a spare vessel.
Experimental
Results
The preliminary
tests performed by the authors have shown that the values of heat capacity C1
and heat of evaporation C2 for the solution do not differ greatly
from the respective values for water; therefore, these parameters have been
taken the same as for water: C1=4.19 kJ per kg degrees and C2=2269 kJ per kg. The experimental
results are given in Table 40.
Table 40.
|
Indices |
1 |
2 |
3 |
Average |
|
1 – mass of empty measuring
glass mo , grams |
… |
… |
… |
345 |
|
2 – mass of the solution
prior its entering the reactor m1, grams |
1200 |
1195 |
1200 |
1198 |
|
3 – mass of the solution
after outflow from the reactor m2, grams |
1180 |
1180 |
1180 |
1180 |
|
4 – mass difference, inlet
and outlet, |
20 |
15 |
20 |
18.3 |
|
5 - reactor inlet
temperature t1 , degrees |
21 |
21 |
21 |
21 |
|
6 - reactor outlet
temperature t2 , degrees |
85 |
85 |
85 |
85 |
|
7 - temperature difference |
64 |
64 |
64 |
64 |
|
8 - duration of the
experiment, t, s |
279 |
307 |
282 |
289 |
|
9 – number of rotations of
the electric meter disc during the experiment n, rot. |
39.5 |
44.5 |
41.5 |
41.8 |
|
10 – electric energy
consumption according to the electric meter readings, E1=n×3600/600, kJ Note: 600 rotations of the
electric meter correspond to 1 kW h of electric power. The electric meter was
connected in the power supply circuit of the reactor before the rectifier and
registered power consumption for the reactor operation and the current rectifier.
The voltmeter and the ammeter are connected in the reactor energy supply
circuit after the rectifier and are aimed for measuring the electric energy
consumed by the reactor. |
237 |
267 |
249 |
251 |
|
11 – readings of voltmeter
V, volts |
196 |
200 |
199 |
198.3 |
|
12 – ammeter readings I, amperes |
3.66 |
3.30 |
3.58 |
3.51 |
|
13 – electric energy
consumption according to the readings of the voltmeter and the ammeter, E2=I×V×t, kJ |
220.1 |
202.6 |
200.9 |
201.2 |
|
14 – power energy for
heating the solution, E3= C1× m1× |
322.0 |
320.4 |
322.0 |
321.5 |
|
15 – energy consumed for
forming of vapours, E4= C2× |
45.4 |
34.0 |
45.4 |
41.6 |
|
16 – total energy for
heating and vapours E0= E3+ E4, kJ |
367.4 |
354.5 |
367.4 |
363.1 |
|
17
– COP of the reactor according to the electric meter readings K1=
E0/ E1 |
1.55 |
1.33 |
1.47 |
1.45 |
|
18
– COP of the reactor according to the voltmeter and ammeter readings K2= E0/ E2 |
1.87 |
1.75 |
1.85 |
1.82 |
The commission has stated that during the experiment it
can be easily seen that gases are flowing out of the connection pipes of the
cathode and anode spaces. These gases are products of the decomposition of the
solution, mainly of the water molecules, and are contributing to the decrease
of the weight of water. The authors have not yet elaborated a method for
measuring the quantity of these gases to those time, and therefore their energy
content was added to the energy content of the water vapours. Given that the
energy content of the gases is much higher than that of the vapours, the COP of
the reactor is higher as stated in Table 39. COP of the reactor ![]() is based on the
reading of the voltmeter and the ammeter and needs to be improved, because the
reactor generates high frequency oscillations, which influence the readings of
the instruments. The commission states that the reactor also generates light
and sound energy.
is based on the
reading of the voltmeter and the ammeter and needs to be improved, because the
reactor generates high frequency oscillations, which influence the readings of
the instruments. The commission states that the reactor also generates light
and sound energy.
The commission is
stating that if the contribution of the emitted gases, the light energy and the
outer energy losses of the reactor are considered the COP values are higher
than those established.
The commission
emphasizes the newness of the plasma formation phenomena at the electrolysis of
water, associated with incompletely studied processes, which generate excess
energy and considers that these deserve further thorough study with the aim of
finding their possible uses in different scientific and technical areas.
The experiment
demonstrates vividly that the plasma – electrolytic reactor generates energy in
the form of heat of the heated solution, vapour of various temperature,
hydrogen and oxygen as well as light radiation noise and high frequency
electric oscillations [65].
In order to measure
all above-mentioned components of total energy generated by the
plasma-electrolytic reactor it is necessary to have the corresponding
instruments and equipment. We have not had such possibility due to lack of
financing, that’s why we have managed to measure thermal energy only and
quantity of generated gases with the help of an anemometer.
The
Foundations of Physchemistry of Microworld
Copyright Ó2003 Kanarev Ph.
M.
Internet Version - http://book.physchemistry.innoplaza.net
<< Back to Physchemistry Book Index